Gold Price Forecast: XAU/USD continues to target $1804 and $1800 support levels – Confluence Detector
- Gold price keeps losses in a familiar range ahead of US data, Fedspeak.
- Pre-NFP caution and covid concerns leave gold price directionless.
- Gold Weekly Forecast: Bulls hesitate as focus shift to NFP.
Gold is holding the lower ground, heading closer towards $1800, as traders remain cautious and refrain from placing any fresh directional bets ahead of the all-important US Nonfarm Payrolls data due this Friday. Gold remains under pressure, courtesy of positive US 10-year Treasury yields, amid a recovery in the risk appetite. However, modest weakness in the US dollar combined with persisting coronavirus concerns continue to lend support to bulls, leaving gold price range-bound.
Attention now turns towards the sentiment on Wall Street, Fedspeak and US Factory Orders data for fresh trading direction in gold price. However, the range play may continue heading into the main event risk – the NFP release.
Read: Gold set to extend the range play above $1800, with eyes on NFP
Gold Price: Key levels to watch
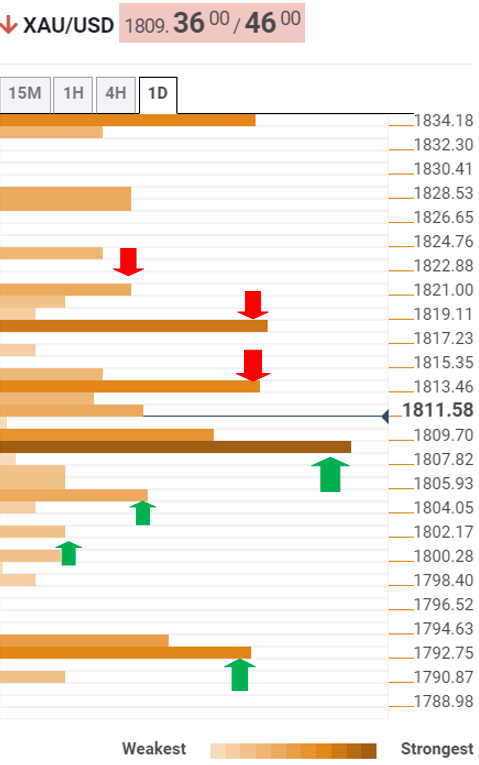
The Technical Confluences Detector shows that gold is challenging critical support at $1809, which is the convergence of the Fibonacci 38.2% one-month, Fibonacci 23.6% one-day, Fibonacci 61.8% one-week and SMA10 one-day.
If the abovementioned support caves in, then gold sellers will look for a test of the next relevant downside target at $1804.
The SMA100 one-day at $1802 could be on the sellers’ radars, below which the pivot point one-day S2 at $1800 could offer some support to the bulls.
The last line of defense for gold price is seen around $1793, the confluence of the previous week’s low and Fibonacci 61.8% one-month.
On the flip side, a dense cluster of healthy resistance levels are placed around $1813, the intersection of the SMA5 one-day, Fibonacci 38.2% one-day and Fibonacci 61.8% one-day.
The next resistance awaits at $1818, where the Fibonacci 38.2% one-week coincides with the Fibonacci 23.6% one-month and the previous day’s high.
The SMA200 one-day at $1820 could continue to cap the further upside.
Here is how it looks on the tool
About Technical Confluences Detector
The TCD (Technical Confluences Detector) is a tool to locate and point out those price levels where there is a congestion of indicators, moving averages, Fibonacci levels, Pivot Points, etc. If you are a short-term trader, you will find entry points for counter-trend strategies and hunt a few points at a time. If you are a medium-to-long-term trader, this tool will allow you to know in advance the price levels where a medium-to-long-term trend may stop and rest, where to unwind positions, or where to increase your position size.